Monitoring system performance is essential for maintaining a healthy Linux environment, especially when managing servers or troubleshooting performance issues. The terminal offers several tools that provide a wealth of information about system resources like CPU, memory, disk usage, and processes. In this post, we’ll introduce five powerful tools: top, htop, Glances, nmon, and bpytop. You’ll learn how to install and use each tool to monitor your system’s performance efficiently.
1. Using top
The top command is one of the most basic and widely available tools for monitoring Linux system performance. It provides a real-time view of CPU, memory, and process usage.
Installation
top is pre-installed on most Linux distributions, so you don’t need to install anything. Simply open your terminal and run:
topUsage
Once the top command is running, you’ll see a live view of system processes and resource usage. You can press q to quit, or use various keys to filter and sort the output (e.g., M to sort by memory).
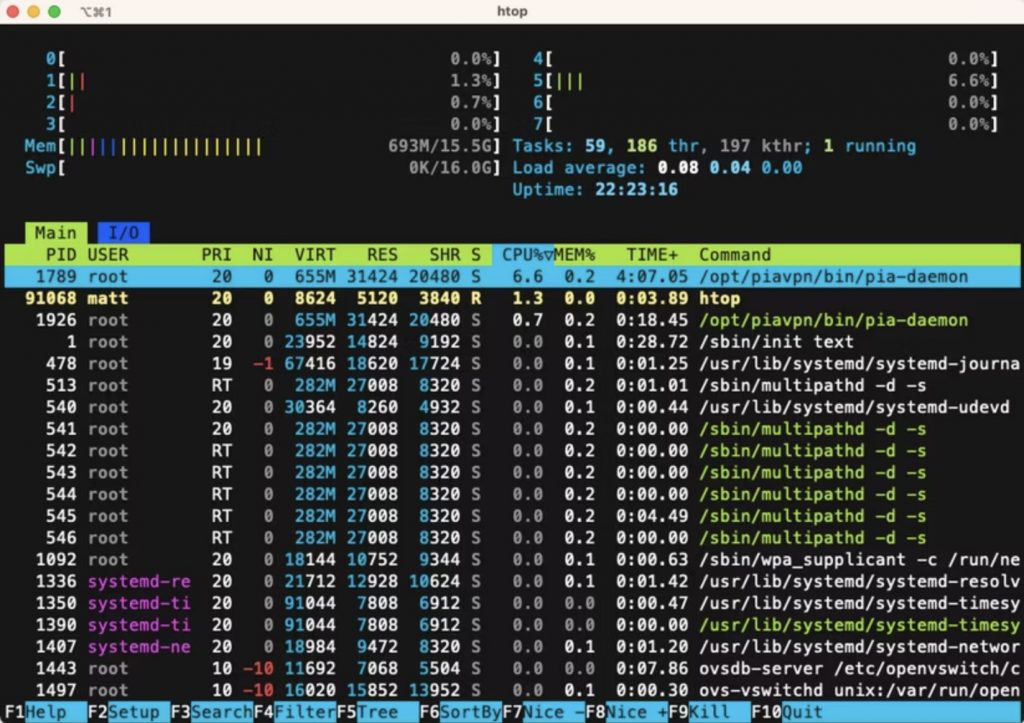
2. Using htop
htop is an enhanced version of top, offering a more user-friendly interface, color-coded information, and additional functionality.
Installation
To install htop, run the following command depending on your Linux distribution:
sudo apt install htop  # Ubuntu/Debian
sudo yum install htop  # CentOS/RHEL
sudo dnf install htop  # Fedora
Usage
Run htop in the terminal, and you’ll see a detailed overview of CPU and memory usage. Use the arrow keys to navigate, F9 to kill processes, and F10 to quit.
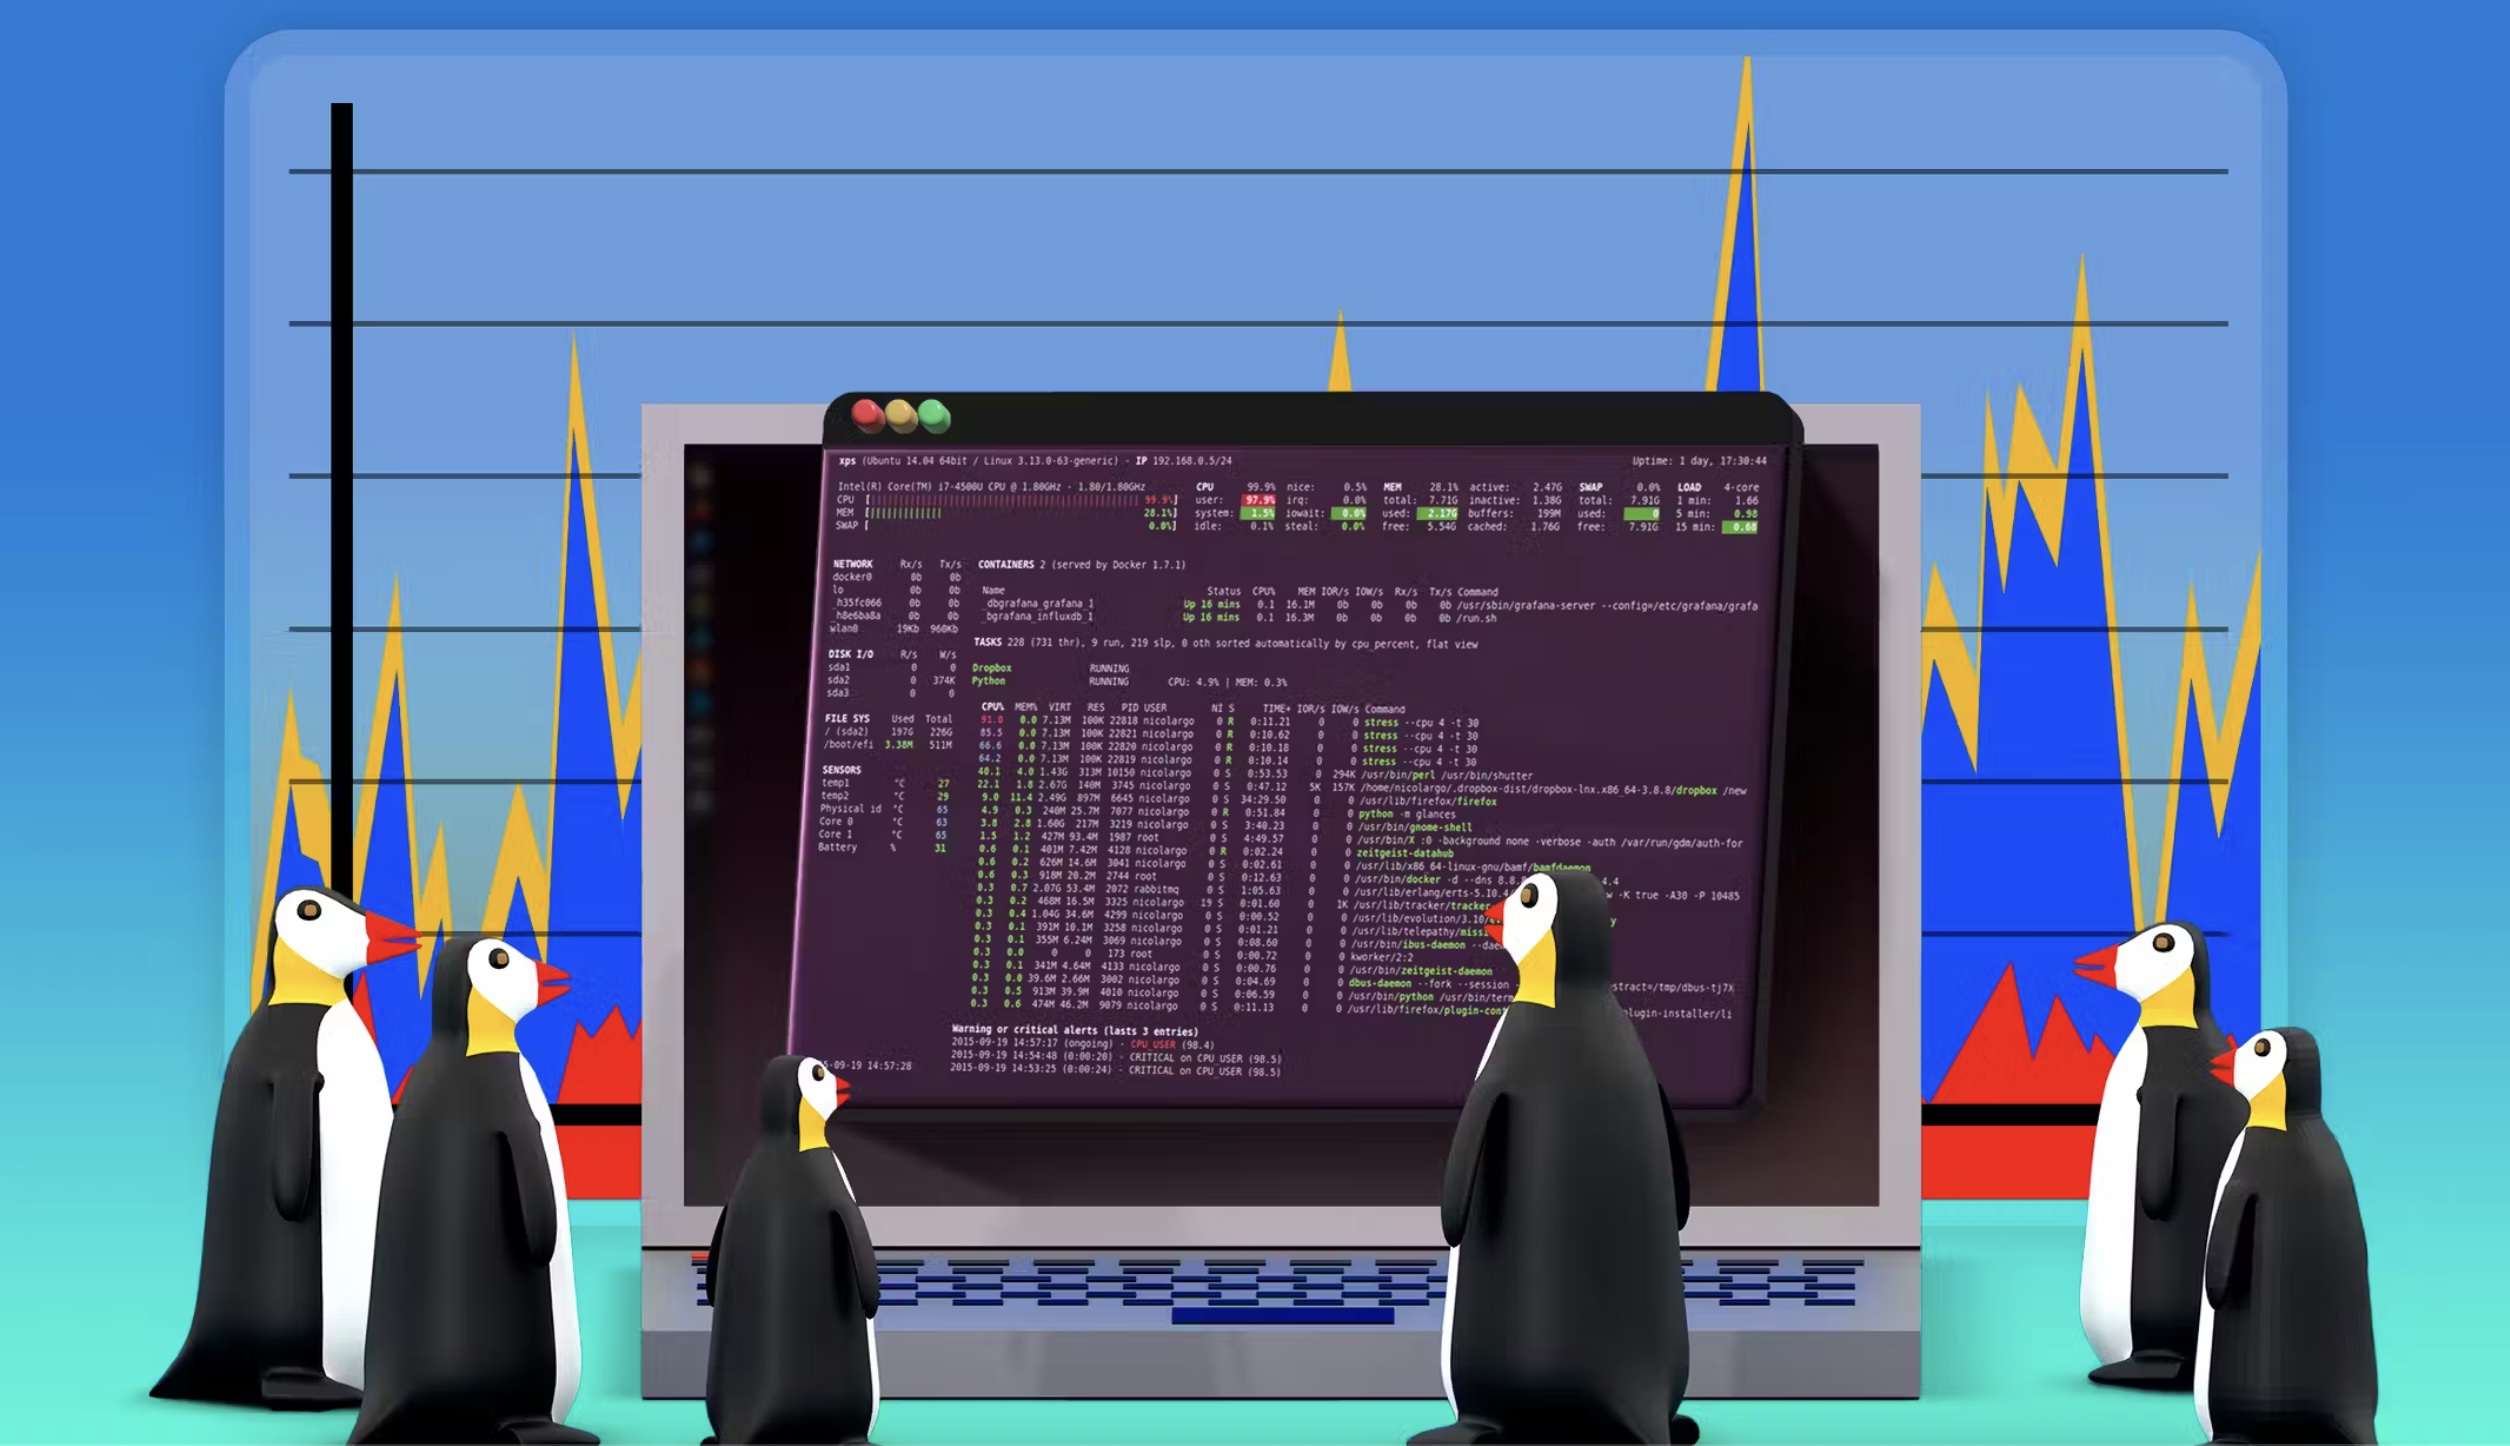
3. Using Glances
Glances is a cross-platform monitoring tool that provides an extensive view of system performance, including CPU, memory, disk I/O, network, and more.
Installation
To install Glances, use the following commands:
sudo apt install glances  # Ubuntu/Debian
sudo yum install glances  # CentOS/RHEL
sudo dnf install glances  # Fedora
Usage
Run glances in the terminal, and you’ll see a wide range of system metrics in real-time. Press q to quit, and use h for a list of interactive commands.
4. Using nmon
nmon (Nigel’s Monitor) is a performance monitoring tool that provides detailed insights into CPU, memory, network, and disk usage.
Installation
Install nmon using the following commands:
sudo apt install nmon  # Ubuntu/Debian
sudo yum install nmon  # CentOS/RHEL
sudo dnf install nmon  # Fedora
Usage
Start nmon by typing nmon in the terminal. Use different keys (e.g., c for CPU, m for memory) to view specific system metrics.
5. Using bpytop
bpytop is a modern, Python-based system monitor with a beautiful, intuitive interface for real-time monitoring of system resources.
Installation
To install bpytop, run:
sudo apt install bpytop  # Ubuntu/Debian
sudo yum install bpytop  # CentOS/RHEL
sudo dnf install bpytop  # Fedora
Usage
Launch bpytop by typing bpytop in the terminal. The interface is highly customizable, and you can use keyboard shortcuts for various features. Press Esc to exit.
Conclusion
Monitoring system performance is critical for ensuring your Linux system runs smoothly. Each of these five tools—top, htop, Glances, nmon, and bpytop—offers unique features and insights. Choose the one that fits your needs and explore the various metrics they provide to keep your system in top shape.
Leave a Reply