• Scheduling One-Time and Recurring Jobs in Linux

    In Linux, efficiently managing tasks to run automatically at specified times is crucial for system administrators and users alike. Two powerful utilities that facilitate this are at for scheduling one-time tasks and crontab for setting up recurring jobs. This guide will cover how to use these tools, including examples and configurations for scheduling tasks.

    Using the at Command for One-Time Tasks

    The at command is used to schedule a job for a one-time execution at a specified time. Jobs scheduled with at are executed only once.

    Examples of Using at

    • Schedule a Job for a Specific Time:echo “echo ‘Hello, World!’ > /tmp/test.txt” | at 10:00 PMThis command schedules a job to write “Hello, World!” to /tmp/test.txt at 10:00 PM today.
    • Schedule a Job for Now + Time Increment:echo “cp /file1 /backup/file1.bak” | at now + 1 hourThis schedules a job to copy /file1 to /backup/file1.bak one hour from the current time.

    More Examples of Using at

    • Schedule a Script to Run at Midnight:at midnight -f /path/to/script.shThis command schedules /path/to/script.sh to be executed at midnight. The -f option allows you to specify a file containing the commands to be executed.
    • Schedule a Job for a Specific Date and Time:echo “/usr/bin/python3 /home/user/backup.py” | at 09:30 AM July 4This schedules a Python script (/home/user/backup.py) to run at 9:30 AM on July 4th.
    • Using Relative Days:at now + 2 daysThis command starts an interactive at session for a job to be executed two days from the current time. You can then enter the commands you wish to schedule and press Ctrl+D to save and exit.
    • Listing Scheduled at Jobs:atqUse this command to list all scheduled at jobs. Each job will have a unique job number.
    • Removing Scheduled at Jobs:atrm [job number]Replace [job number] with the actual job number to remove a scheduled job. Job numbers can be found using the atq command.

    Using `crontab` for Recurring Jobs

    The crontab command is designed for scheduling recurring jobs. It uses a daemon called crond to execute tasks at predefined times or intervals.

    Understanding crontab Configuration

    A crontab file consists of lines of six fields each. The fields are separated by spaces and represent a time to run the job and the command to be run at that time.

    The format is as follows:

    MIN HOUR DOM MON DOW CMD
    • MIN – Minute field (0 – 59)
    • HOUR – Hour field (0 – 23)
    • DOM – Day of Month (1 – 31)
    • MON – Month field (1 – 12)
    • DOW – Day of Week (0 – 6) where Sunday is 0
    • CMD – The command to run

    Examples of crontab Schedules

    • Every Minute:* * * * * /path/to/command
    • Every Hour at the Half Hour:30 * * * * /path/to/command
    • Daily at Midnight:0 0 * * * /path/to/command
    • Weekly on Sunday at 2 AM:0 2 * * 0 /path/to/command
    • Monthly on the 1st at 4 AM:0 4 1 * * /path/to/command
    • Yearly on January 1st at Midnight:0 0 1 1 * /path/to/command

    Editing Your Crontab File

    To edit your crontab file, simply run:

    crontab -e

    This command opens your crontab file in the default editor. Here, you can add, modify, or delete tasks as needed.

    Viewing Your Crontab Entries

    To view your current crontab entries:

    crontab -l

    Cron Permissions

    By default, cron jobs can be created by any user on the system. However, system administrators can control access to the cron service using the /etc/cron.allow and /etc/cron.deny files.

    • Using /etc/cron.allow: If this file exists, only users listed in it are allowed to create and manage their cron jobs. If a user is not listed in cron.allow, they will be denied access to cron services.
    • Using /etc/cron.deny: If /etc/cron.allow does not exist but /etc/cron.deny does, then any user not listed in cron.deny can create and manage cron jobs. If a user is listed in cron.deny, they are denied access.
    • No Restrictions: If neither /etc/cron.allow nor /etc/cron.deny exists, then all users can create and manage their cron jobs, depending on the system’s default permissions settings.

    It’s important for system administrators to properly configure these files to ensure only authorized users can schedule tasks on the system. Misconfiguration can lead to unauthorized or malicious tasks being scheduled, potentially harming the system or compromising security.

    Conclusion

    Understanding and utilizing at and crontab, along with proper permission management, allows for efficient task scheduling and automation in Linux. Whether you need a task to run once at a specific time or recurring jobs, these tools and security measures ensure your system operates smoothly and securely.
  • Monitor Linux System Performance From the Terminal With These 5 Tools

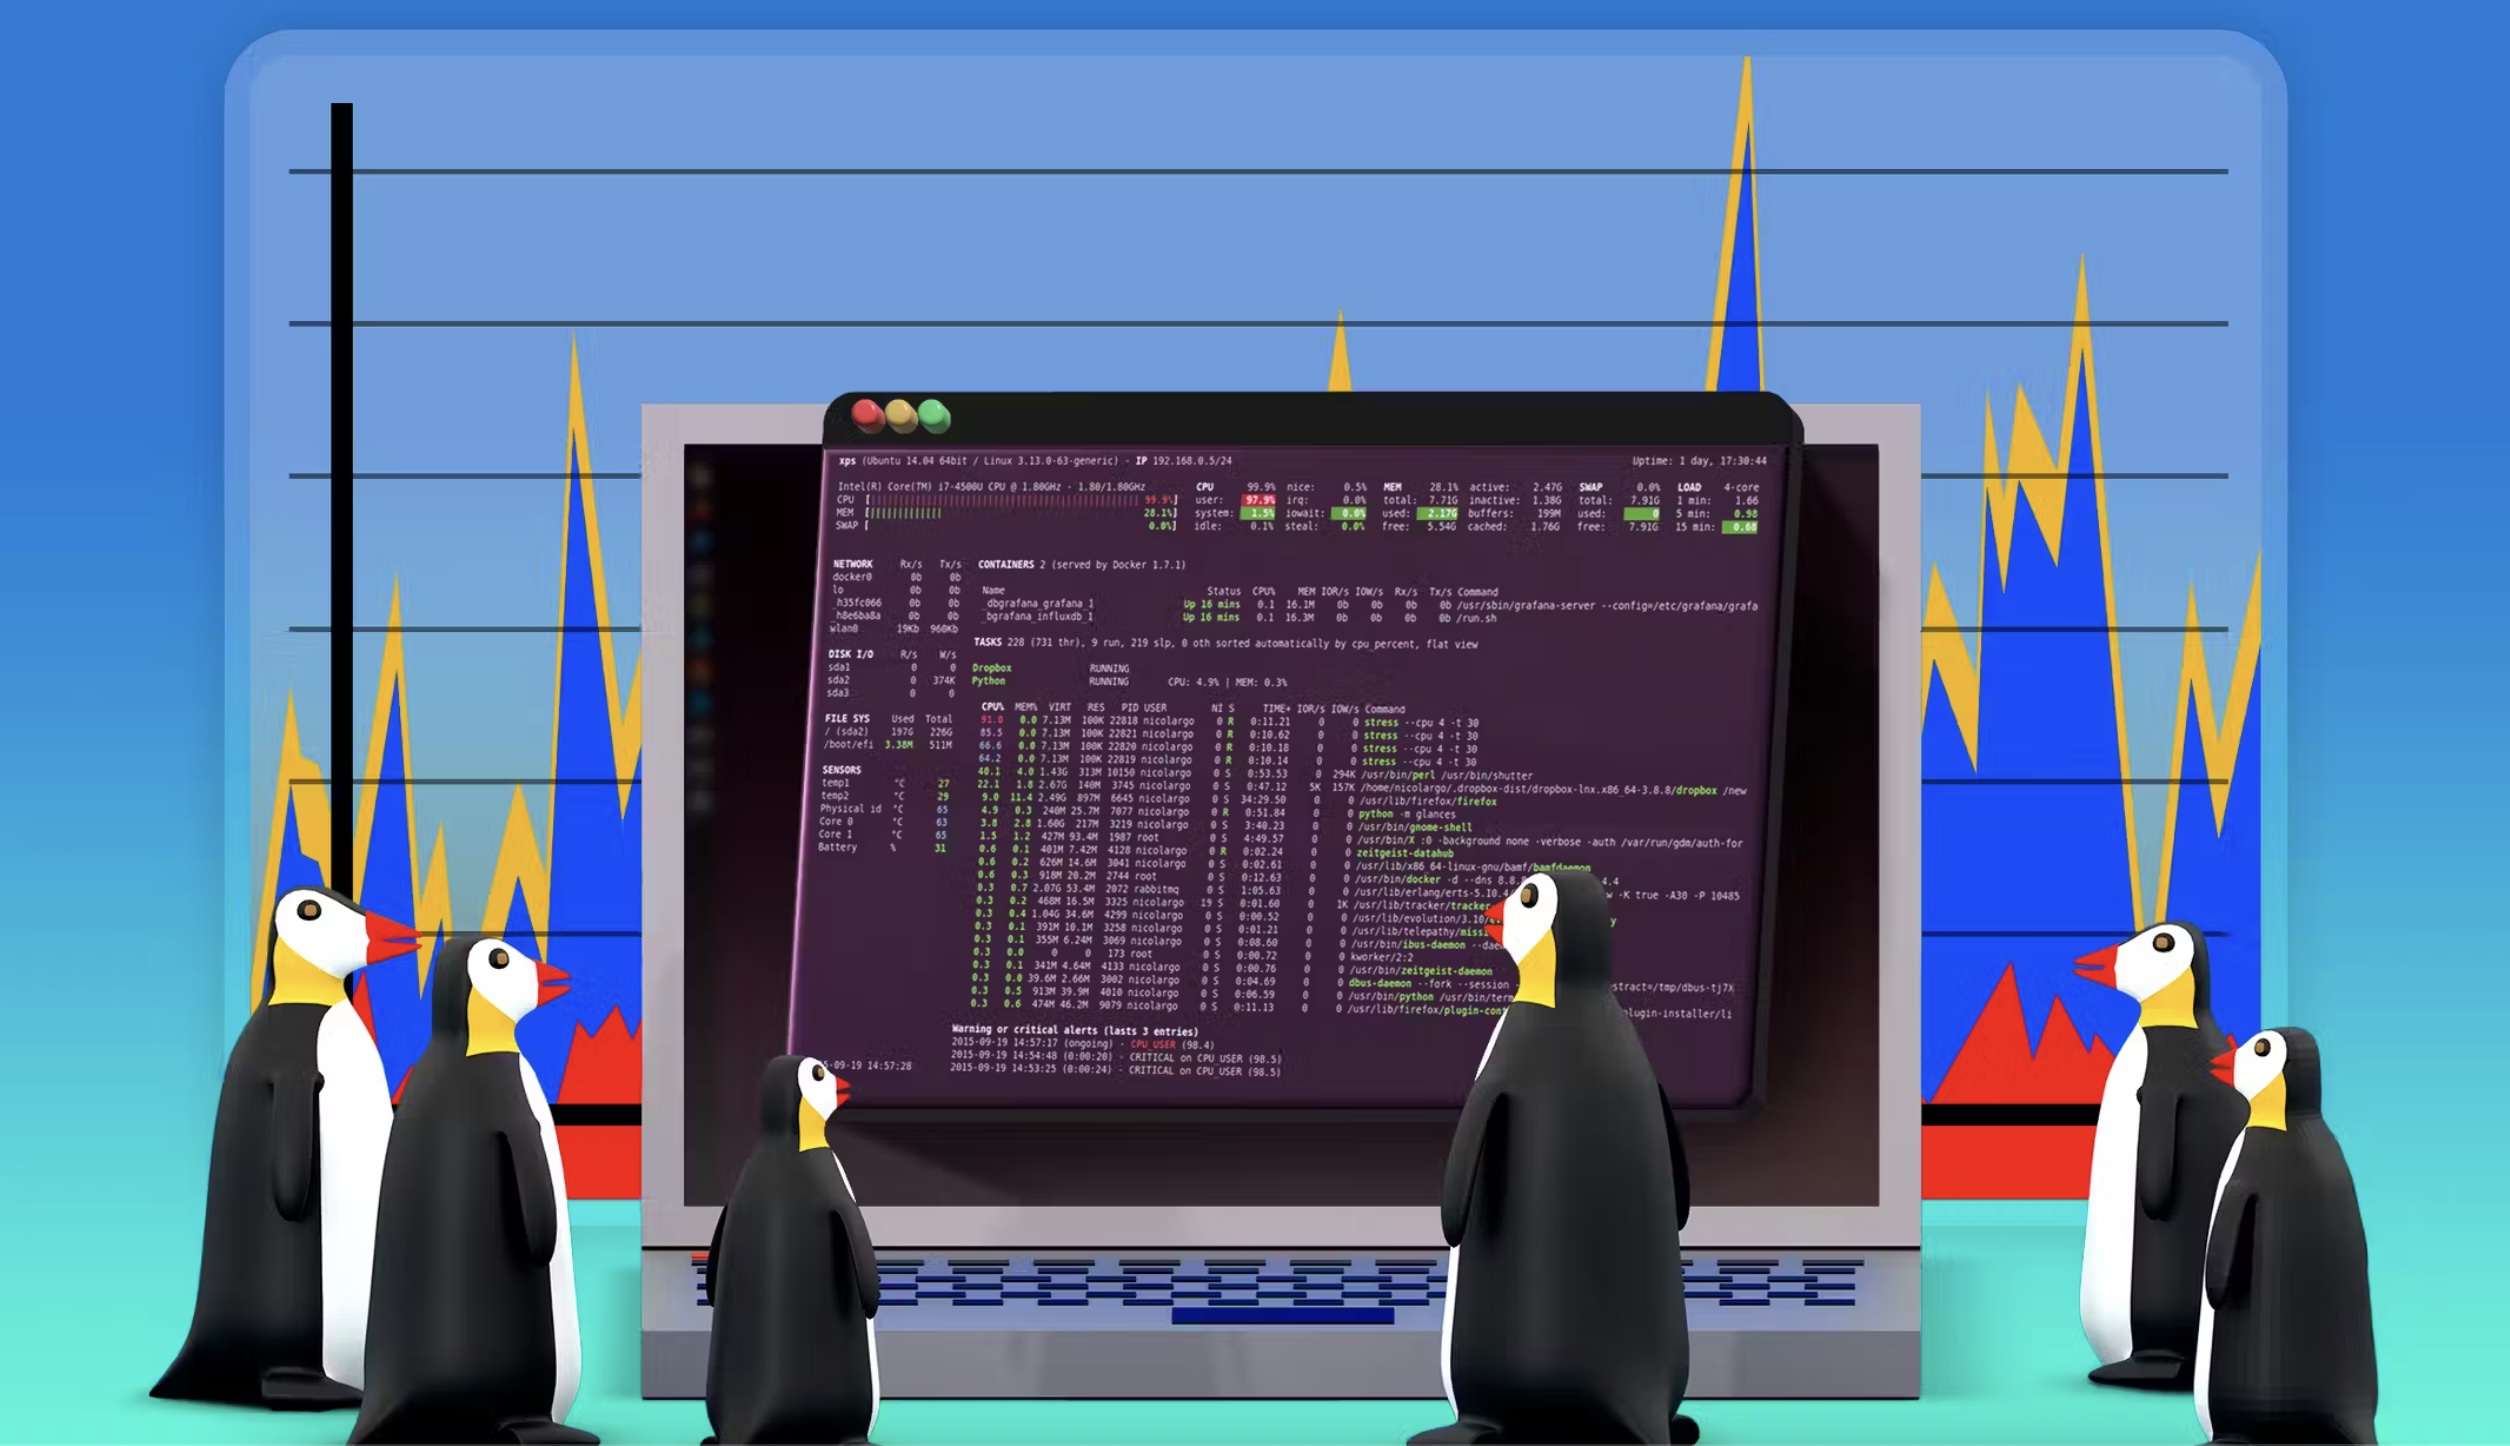
    Monitoring system performance is essential for maintaining a healthy Linux environment, especially when managing servers or troubleshooting performance issues. The terminal offers several tools that provide a wealth of information about system resources like CPU, memory, disk usage, and processes. In this post, we’ll introduce five powerful tools: tophtopGlancesnmon, and bpytop. You’ll learn how to install and use each tool to monitor your system’s performance efficiently.

    1. Using top

    The top command is one of the most basic and widely available tools for monitoring Linux system performance. It provides a real-time view of CPU, memory, and process usage.

    Installation

    top is pre-installed on most Linux distributions, so you don’t need to install anything. Simply open your terminal and run:

    top

    Usage

    Once the top command is running, you’ll see a live view of system processes and resource usage. You can press q to quit, or use various keys to filter and sort the output (e.g., M to sort by memory).

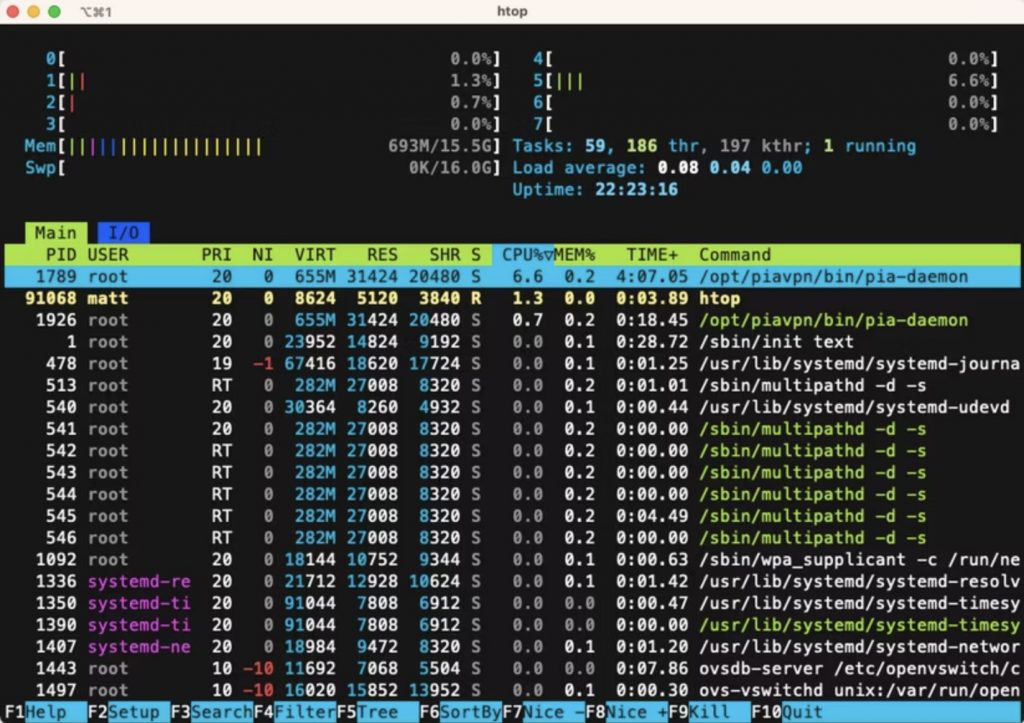
    2. Using htop

    htop is an enhanced version of top, offering a more user-friendly interface, color-coded information, and additional functionality.

    Installation

    To install htop, run the following command depending on your Linux distribution:

    sudo apt install htop  # Ubuntu/Debian
    sudo yum install htop  # CentOS/RHEL
    sudo dnf install htop  # Fedora

    Usage

    Run htop in the terminal, and you’ll see a detailed overview of CPU and memory usage. Use the arrow keys to navigate, F9 to kill processes, and F10 to quit.

    Screenshot

    3. Using Glances

    Glances is a cross-platform monitoring tool that provides an extensive view of system performance, including CPU, memory, disk I/O, network, and more.

    Installation

    To install Glances, use the following commands:

    sudo apt install glances  # Ubuntu/Debian
    sudo yum install glances  # CentOS/RHEL
    sudo dnf install glances  # Fedora

    Usage

    Run glances in the terminal, and you’ll see a wide range of system metrics in real-time. Press q to quit, and use h for a list of interactive commands.

    4. Using nmon

    nmon (Nigel’s Monitor) is a performance monitoring tool that provides detailed insights into CPU, memory, network, and disk usage.

    Installation

    Install nmon using the following commands:

    sudo apt install nmon  # Ubuntu/Debian
    sudo yum install nmon  # CentOS/RHEL
    sudo dnf install nmon  # Fedora

    Usage

    Start nmon by typing nmon in the terminal. Use different keys (e.g., c for CPU, m for memory) to view specific system metrics.

    5. Using bpytop

    bpytop is a modern, Python-based system monitor with a beautiful, intuitive interface for real-time monitoring of system resources.

    Installation

    To install bpytop, run:

    sudo apt install bpytop  # Ubuntu/Debian
    sudo yum install bpytop  # CentOS/RHEL
    sudo dnf install bpytop  # Fedora

    Usage

    Launch bpytop by typing bpytop in the terminal. The interface is highly customizable, and you can use keyboard shortcuts for various features. Press Esc to exit.

    Conclusion

    Monitoring system performance is critical for ensuring your Linux system runs smoothly. Each of these five tools—tophtopGlancesnmon, and bpytop—offers unique features and insights. Choose the one that fits your needs and explore the various metrics they provide to keep your system in top shape.

  • Monitor & Management of Linux Processes using Top Command

    In Linux environments, managing system processes efficiently is crucial for optimal performance and resource utilization. The top command serves as a powerful tool for real-time process monitoring, providing insights into CPU, memory, and overall system performance.

    Introduction to Top Command

    The top command is a versatile utility that offers a dynamic, real-time overview of system processes. When executed, it presents a continuously updated list of processes, sorted by various criteria such as CPU usage, memory consumption, and more.

    Understanding the Display

    Upon running the top command, the display is divided into several sections:

    • Header: Provides summary information about system uptime, total number of processes, CPU usage, memory usage, and more.
    • Process List: Displays a list of running processes, sorted by default based on CPU usage.
    • Command Bar: Offers interactive commands for managing processes, such as sorting, filtering, and killing.

    Changing Display Modes

    The top command allows users to customize the display according to specific monitoring requirements. Here are some common display modes:

    Memory Usage Mode

    To view processes sorted by memory usage:

    top -o RES
        

    This command sorts the process list based on the amount of memory (RES) each process is utilizing.

    CPU Usage Mode

    To display processes sorted by CPU usage:

    top -o CPU
        

    Using this command, processes are sorted based on their CPU consumption, with the most CPU-intensive processes listed at the top.

    Filtering Processes by User ID

    To filter processes by a specific user ID:

    top -u username
        

    Replace username with the desired user’s username. This command displays only the processes associated with the specified user.

    Killing Processes

    To terminate a process using the top command:

    1. Run top.
    2. Identify the PID (Process ID) of the process you want to terminate.
    3. Press k to enter PID mode.
    4. Enter the PID of the process.
    5. Press Enter.
    6. Confirm the action by pressing y.

    This process termination method provides a safe and controlled way to stop misbehaving or unnecessary processes.

    Keyboard Shortcuts

    While running the top command, users can utilize various keyboard shortcuts for enhanced functionality:

    • m: Toggle memory usage mode.
    • p: Toggle CPU usage mode.
    • k: Kill a process by entering its PID.
    • Shift + M: Sort processes by memory usage.
    • Shift + P: Sort processes by CPU usage.
    • Shift + U: Filter processes by user ID.
    • Shift + T: Sort processes by cumulative CPU time.
    • Shift + R: Reverse the sort order of processes.
    • Shift + H: Toggle thread display.

    Examples

    Let’s delve into practical examples of utilizing the top command:

    Example 1: View Memory Usage

    top -o RES
        

    This command sorts processes based on their memory utilization, allowing administrators to identify memory-intensive processes.

    Example 2: View CPU Usage

    top -o CPU
        

    With this command, users can monitor CPU-intensive processes, helping in troubleshooting performance issues related to CPU utilization.

    Example 3: Filter Processes by User ID

    top -u myusername
        

    By specifying a username, this command filters and displays processes associated with the specified user only.

    Example 4: Kill a Process

    To terminate a process with PID 1234:

    top
    k
    1234
        

    By entering the PID and confirming the action, the selected process is safely terminated, freeing up system resources.

    Watch Video Tutorial

    Conclusion

    The top command is an invaluable tool for Linux system administrators, offering real-time insights into system processes and resource utilization. By leveraging its various display modes, keyboard shortcuts, and functionalities, administrators can effectively manage and optimize system performance.